Author: Tom Wragg
Highcharts Example
We will now create an example to display data using the highcharts Ichimoku Cloud technical analysis indicator.
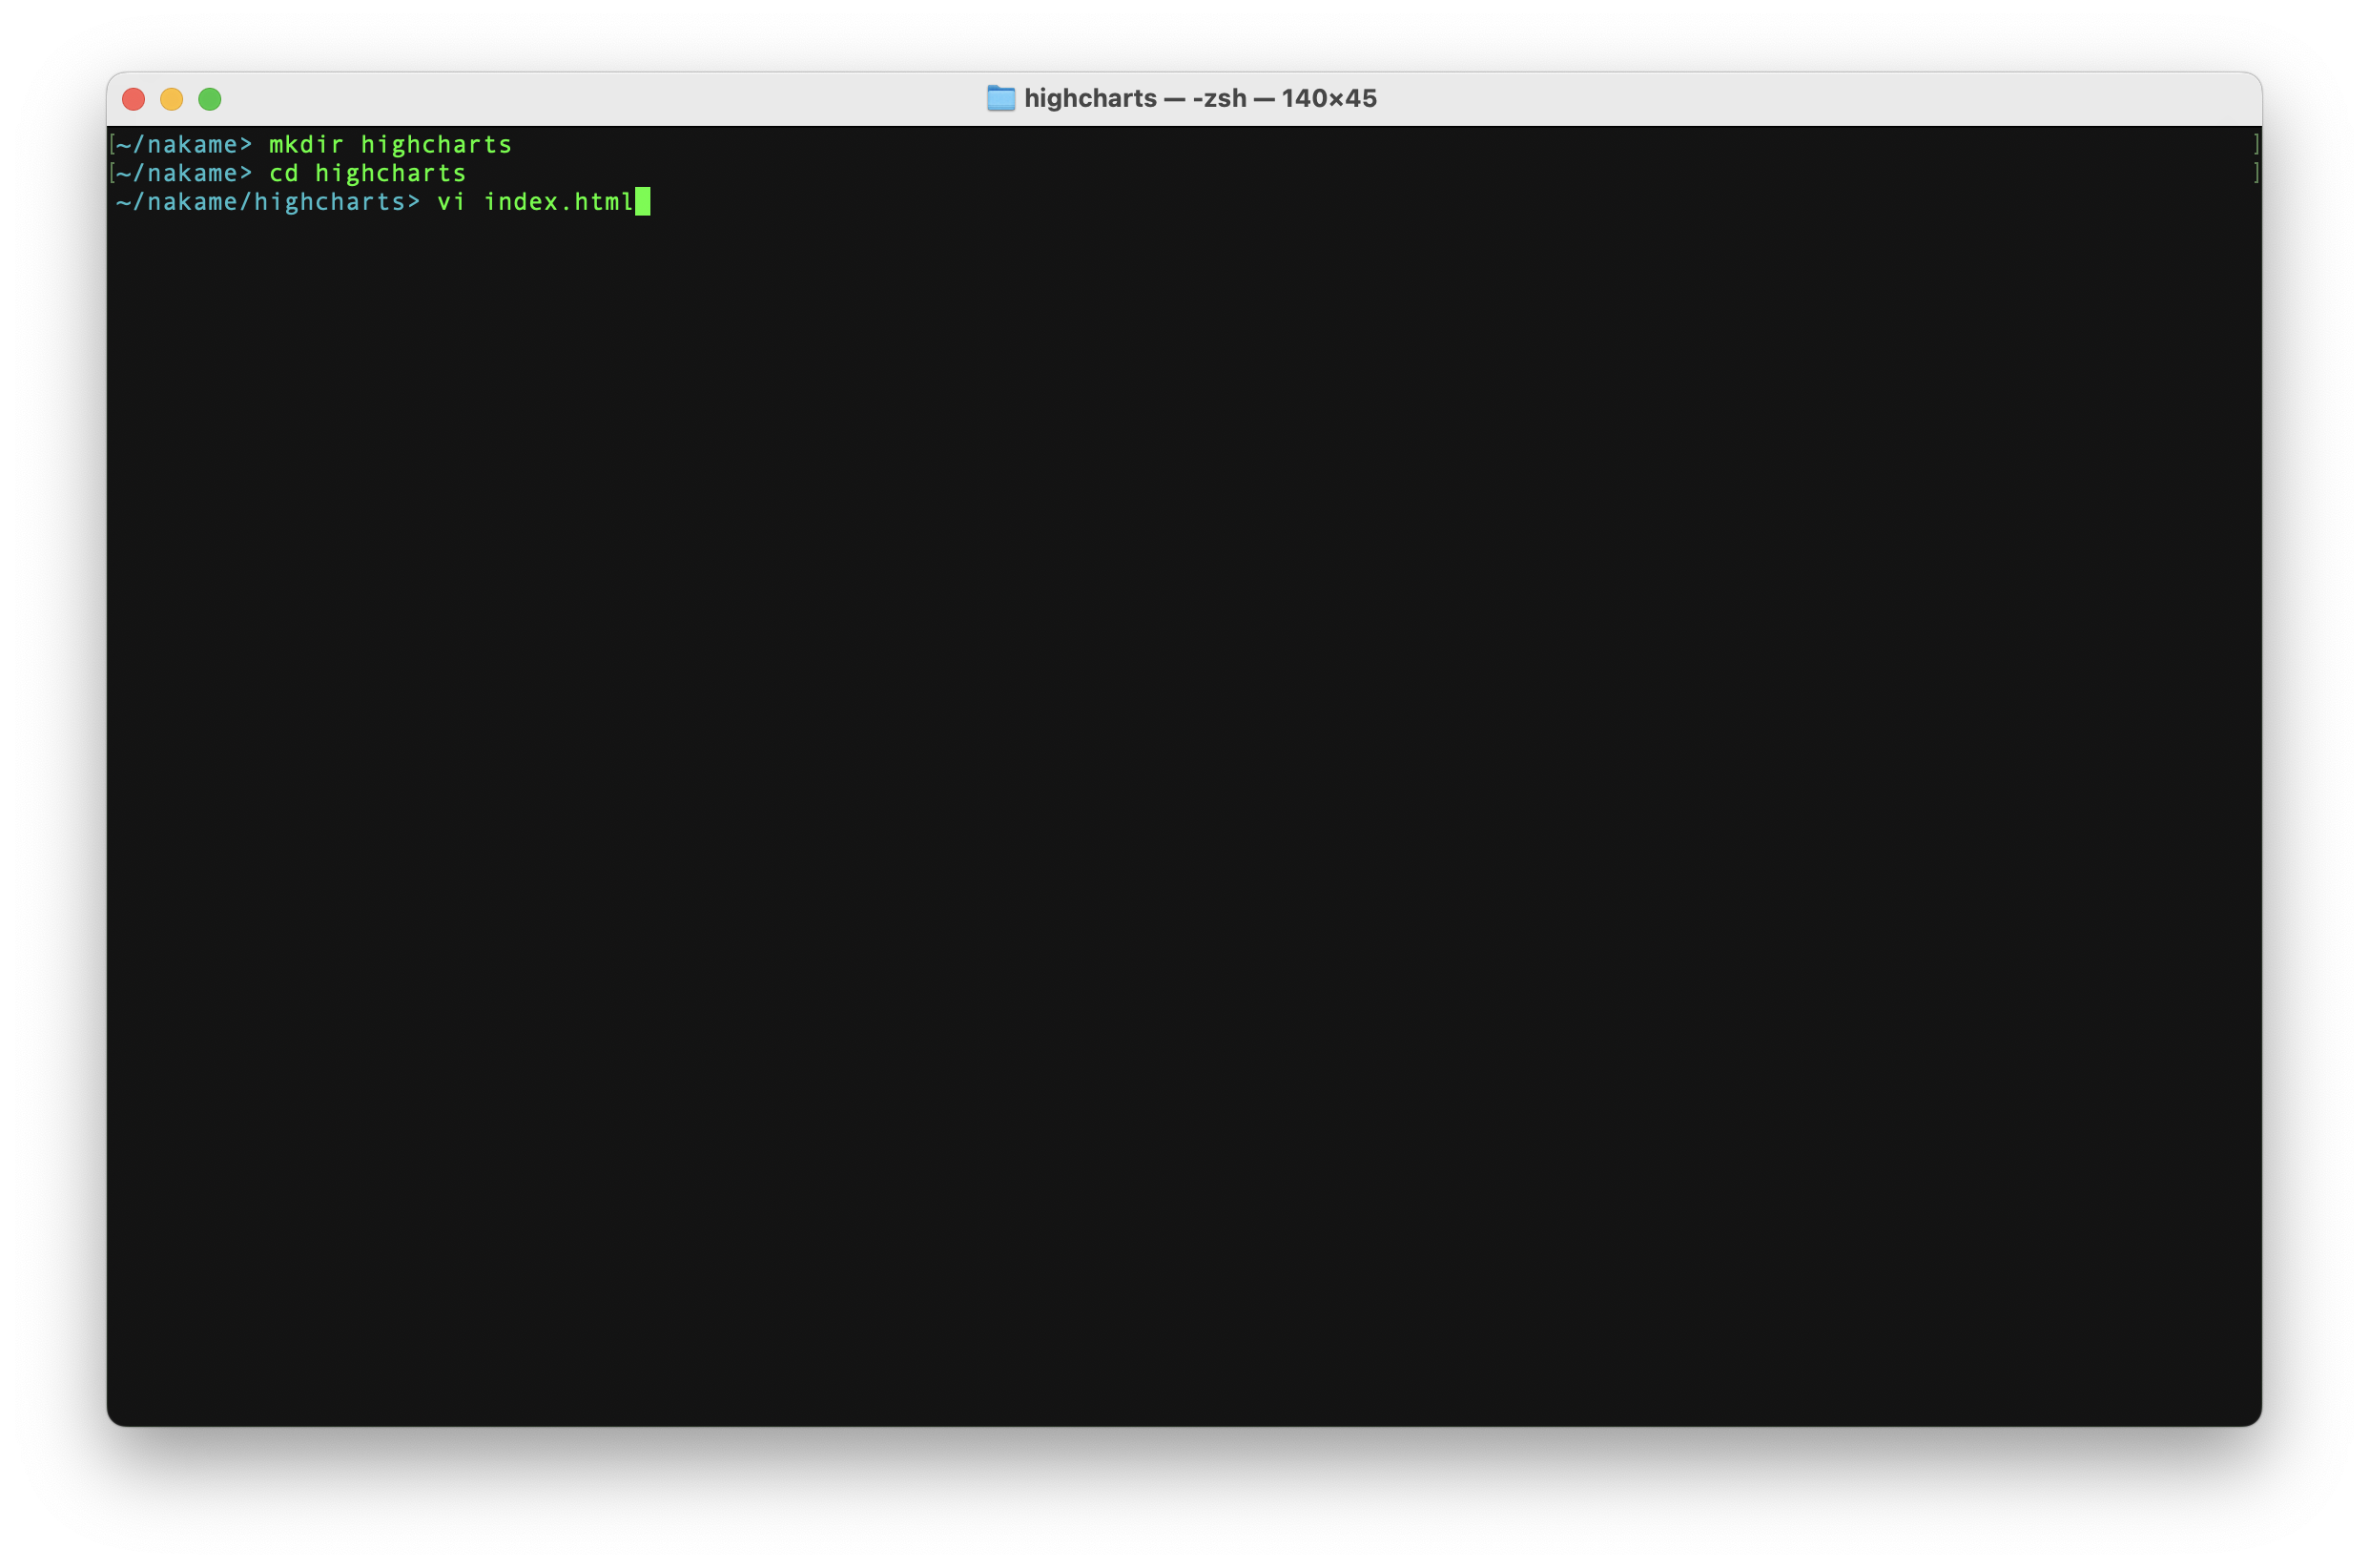
Open your terminal and type the following commands to create a new folder and example index page:-
mkdir highcharts
cd highcharts
vi index.html

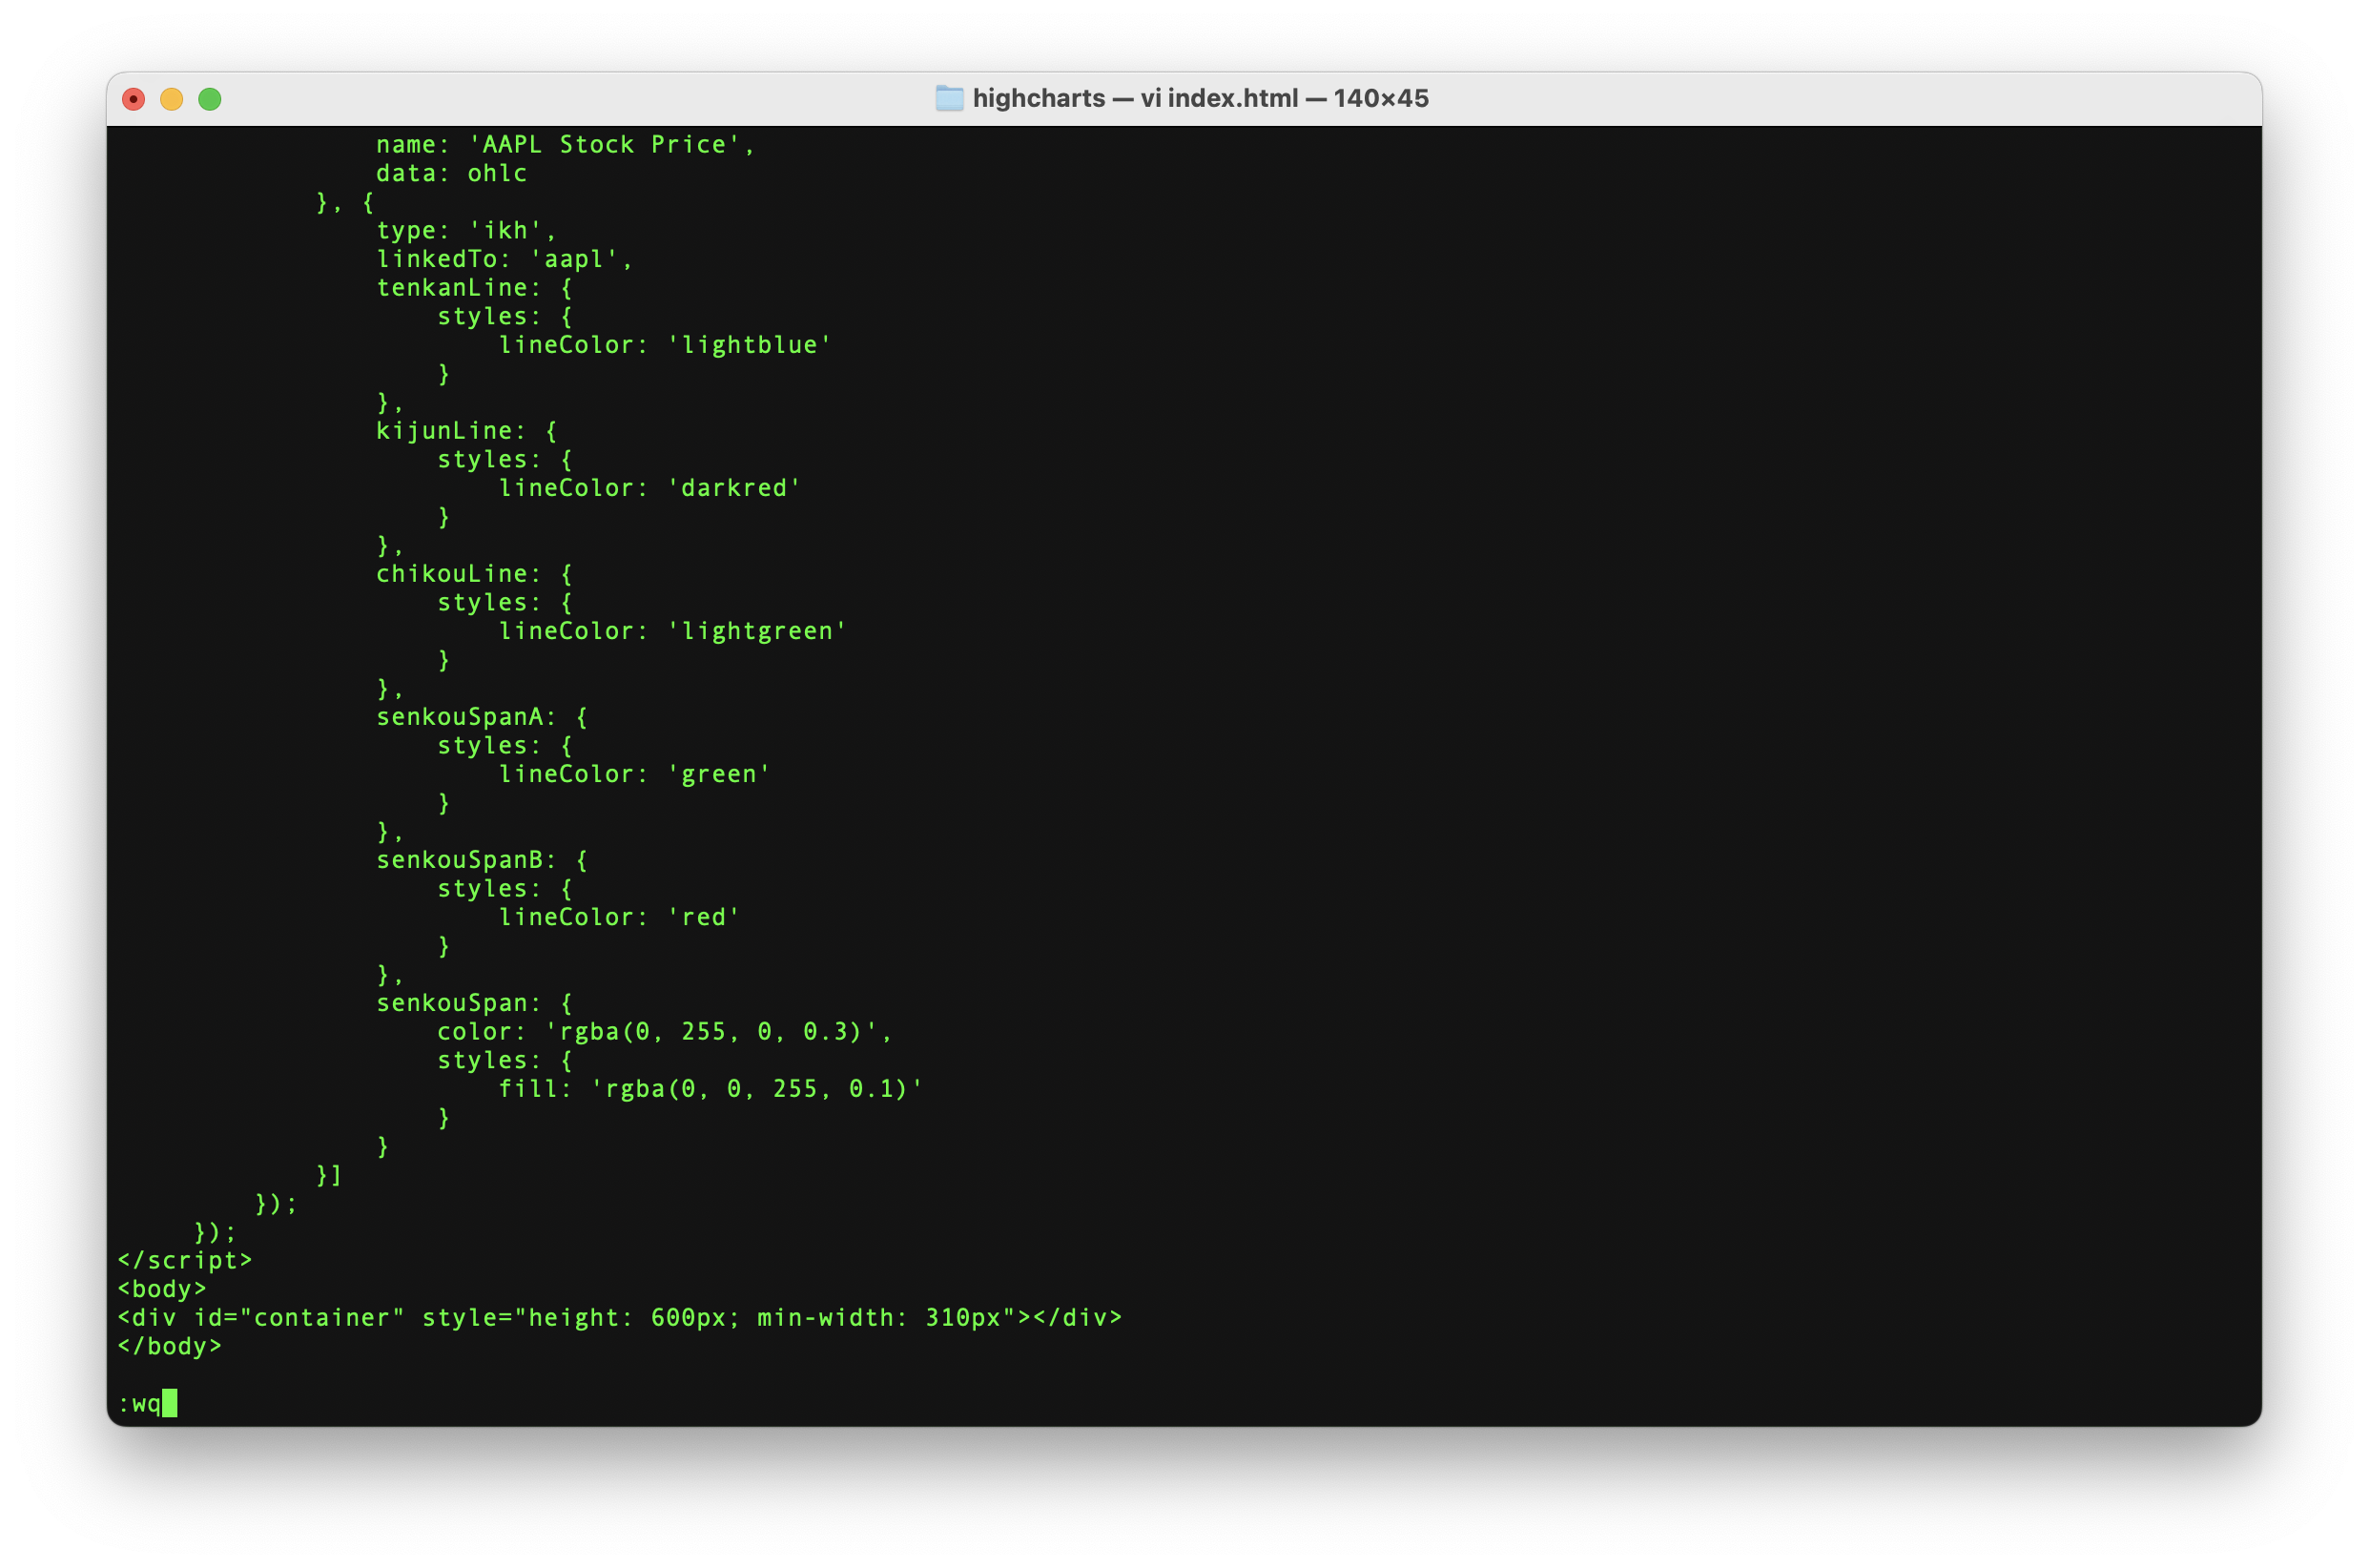
Paste the following ichimoku cloud example using Apple stock and save the file:-
<!DOCTYPE html>
<meta charset="utf-8">

<script src="https://code.highcharts.com/stock/highstock.js"></script>
<script src="https://code.highcharts.com/stock/modules/data.js"></script>
<script src="https://code.highcharts.com/stock/modules/exporting.js"></script>
<script src="https://code.highcharts.com/stock/indicators/indicators.js"></script>
<script src="https://code.highcharts.com/stock/indicators/ichimoku-kinko-hyo.js"></script>

<script>
        Highcharts.getJSON('https://demo-live-data.highcharts.com/aapl-ohlcv.json', function (data) {

        // split the data set into ohlc and volume
        var ohlc = [],
            volume = [],
            dataLength = data.length,
            i = 0;

        for (i; i < dataLength; i += 1) {
            ohlc.push([
                data[i][0], // the date
                data[i][1], // open
                data[i][2], // high
                data[i][3], // low
                data[i][4] // close
            ]);

            volume.push([
                data[i][0], // the date
                data[i][5] // the volume
            ]);
        }

         Highcharts.stockChart('container', {

             rangeSelector: {
                 selected: 2
             },

             title: {
                 text: 'AAPL Stock Price'
             },
             legend: {
                 enabled: true
             },

             plotOptions: {
                 series: {
                     showInLegend: true
                 }
             },

             series: [{
                 type: 'ohlc',
                 id: 'aapl',
                 name: 'AAPL Stock Price',
                 data: ohlc
             }, {
                 type: 'ikh',
                 linkedTo: 'aapl',
                 tenkanLine: {
                     styles: {
                         lineColor: 'lightblue'
                     }
                 },
                 kijunLine: {
                     styles: {
                         lineColor: 'darkred'
                     }
                 },
                 chikouLine: {
                     styles: {
                         lineColor: 'lightgreen'
                     }
                 },
                 senkouSpanA: {
                     styles: {
                         lineColor: 'green'
                     }
                 },
                 senkouSpanB: {
                     styles: {
                         lineColor: 'red'
                     }
                 },
                 senkouSpan: {
                     color: 'rgba(0, 255, 0, 0.3)',
                     styles: {
                         fill: 'rgba(0, 0, 255, 0.1)'
                     }
                 }
             }]
         });
     });
</script>
<body>
<div id="container" style="height: 600px; min-width: 310px"></div>
</body>

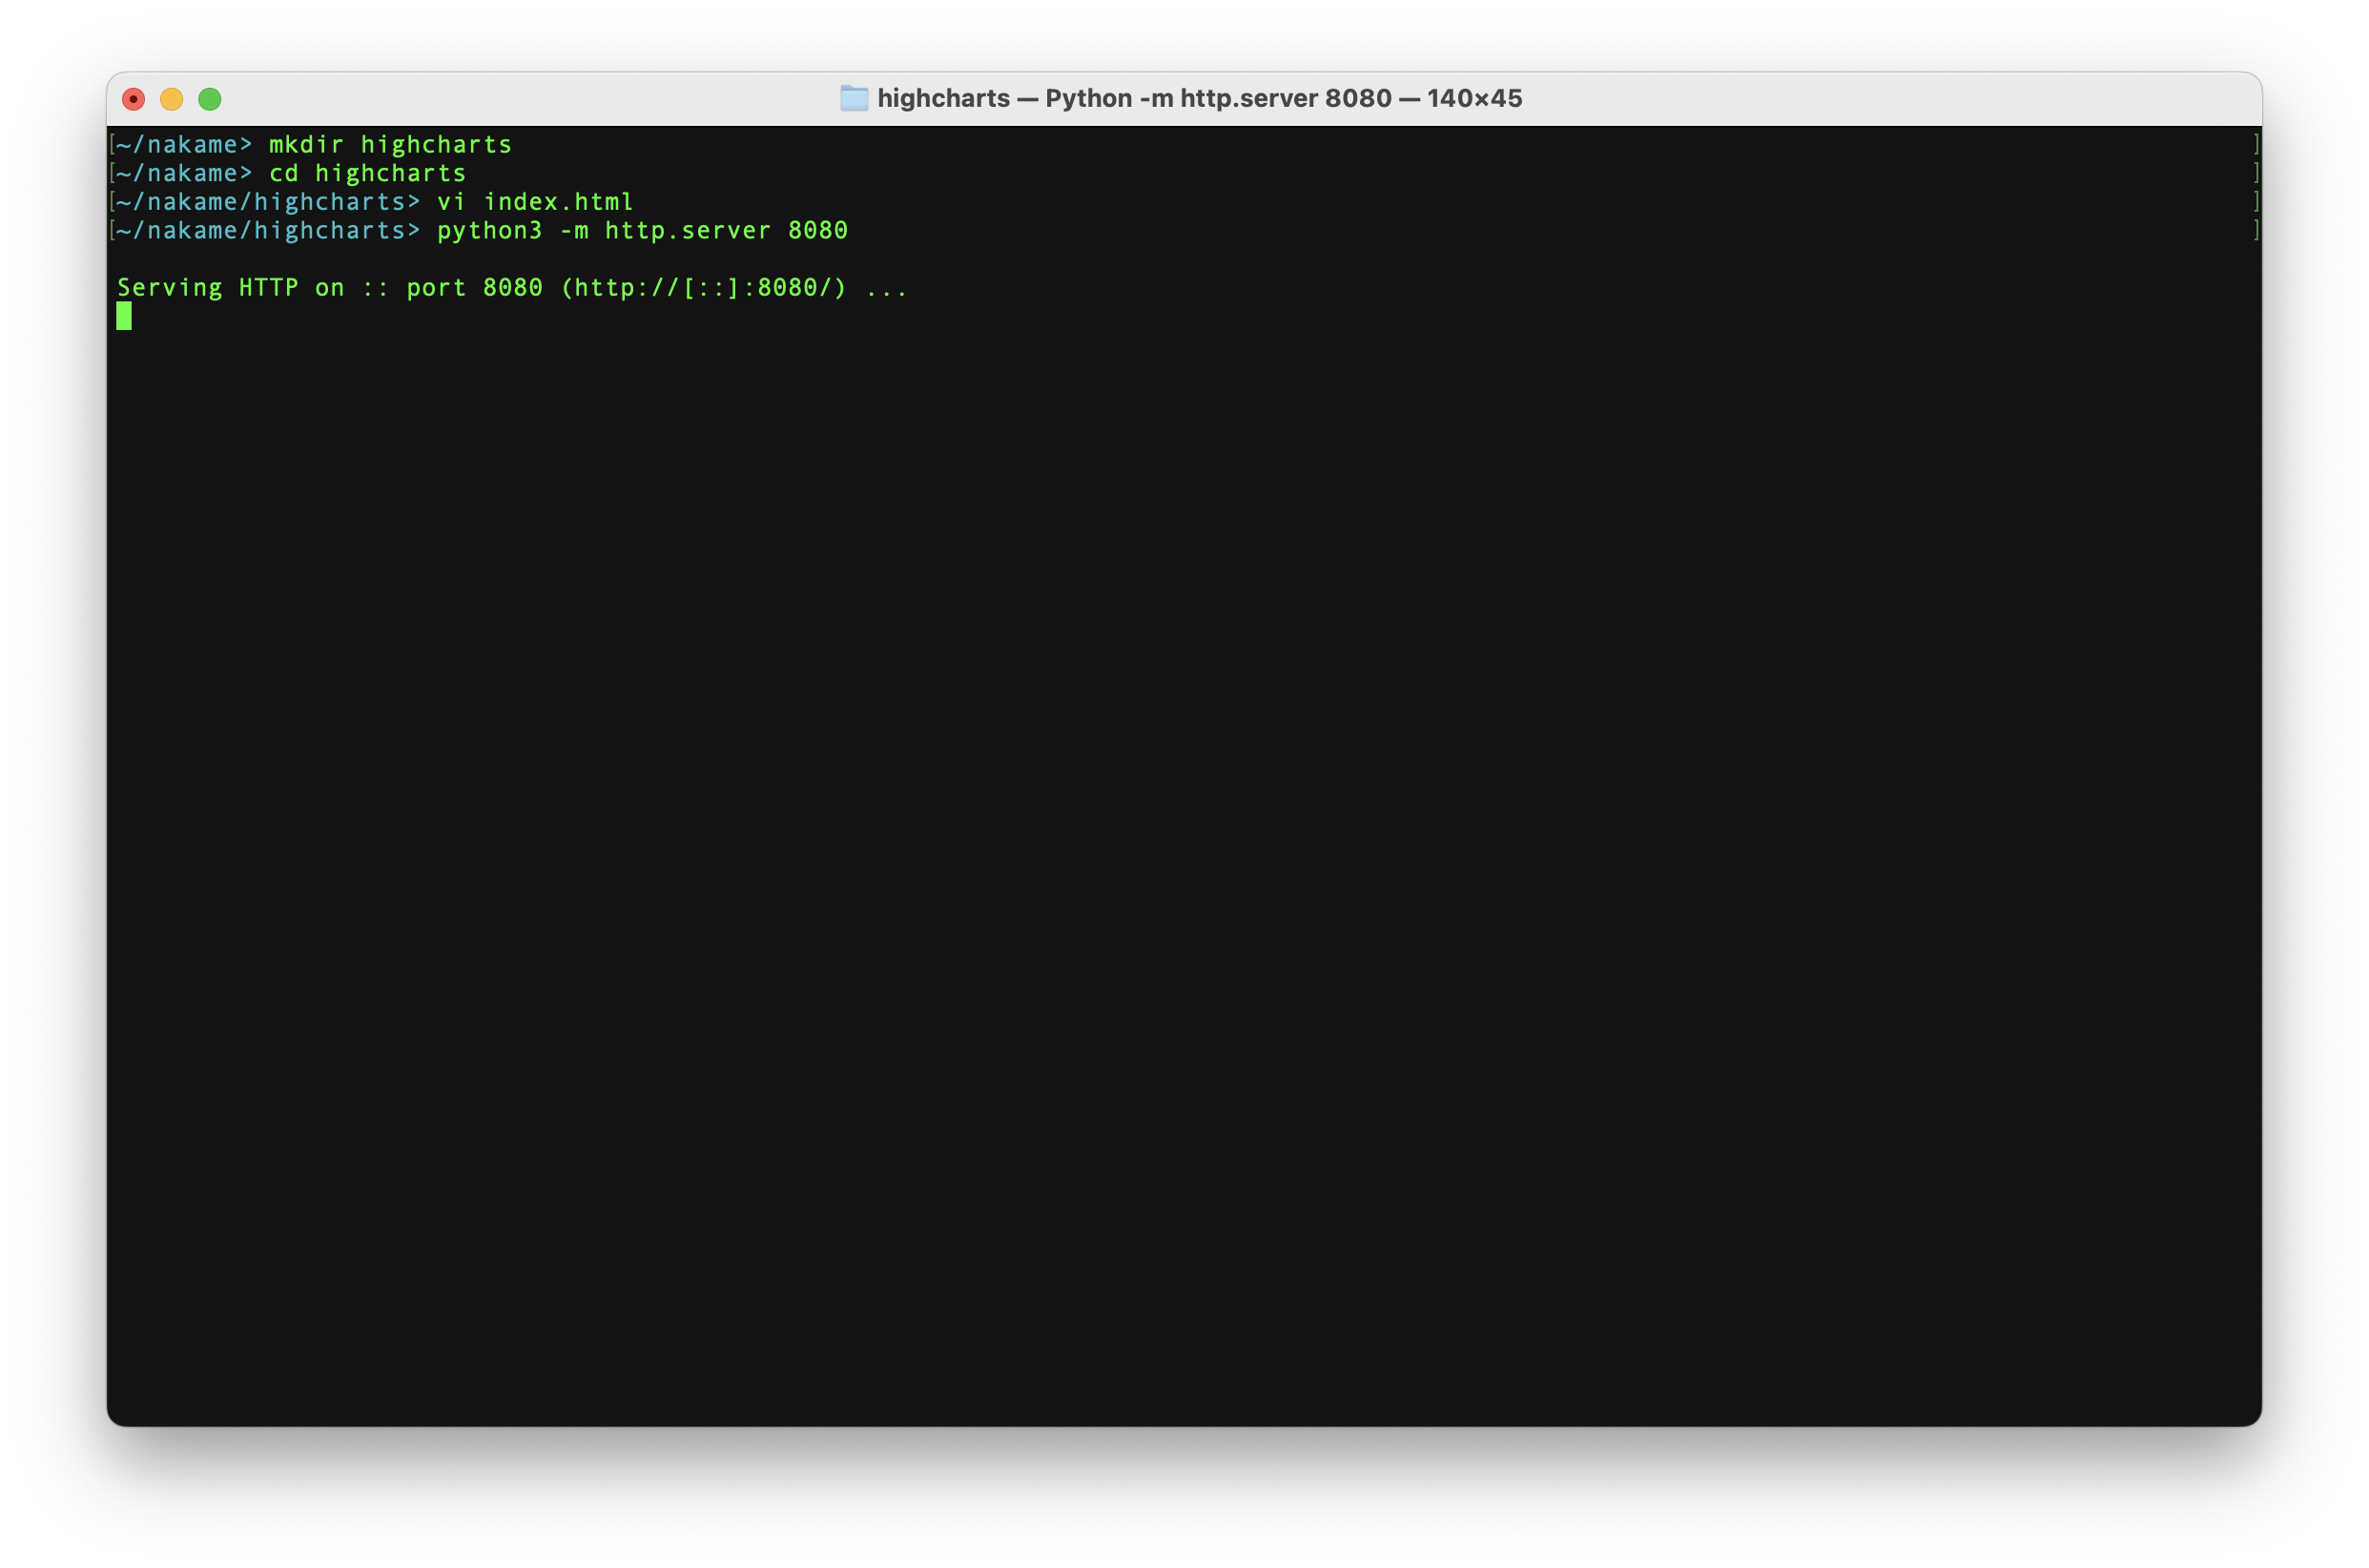
Start up the server:-
python3 -m http.server 8080

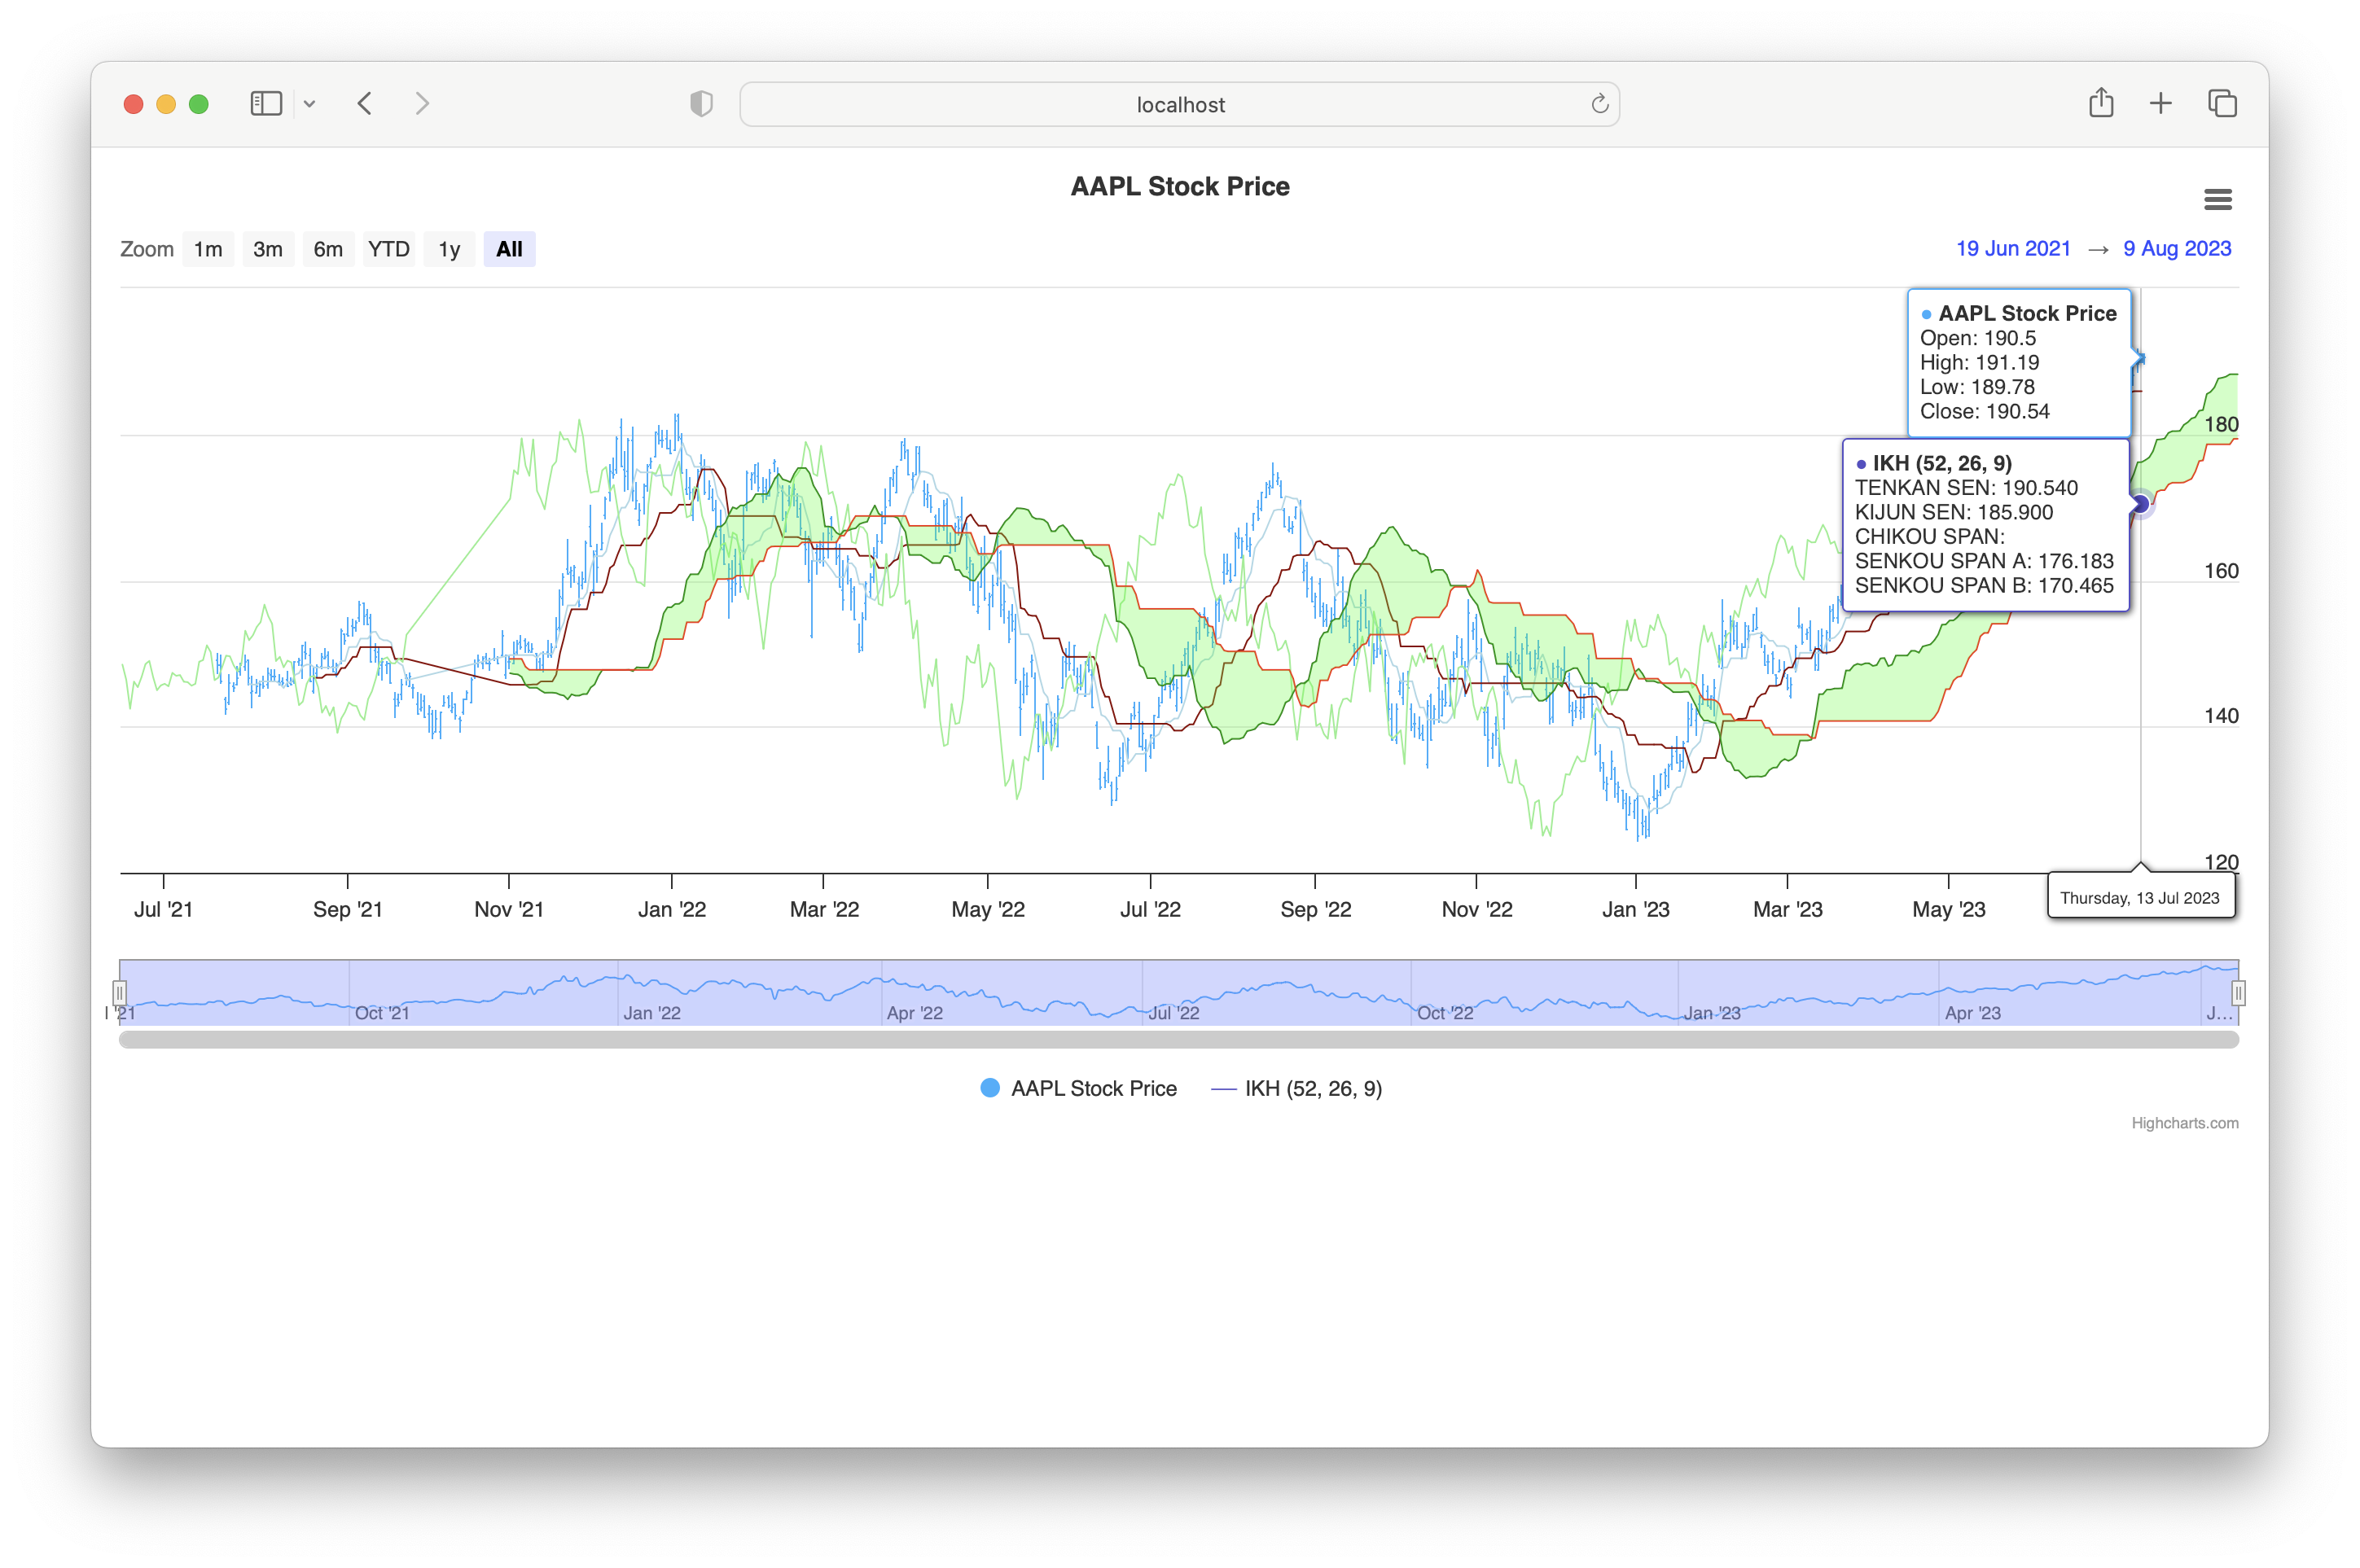
Browse to the following url to view the charting and click on All to see the Ichimoku Cloud in action:-
